80% of SMBs Lose 15h/Week: The 8 Real Reasons (2026)
80% of SMBs lose 15h/week on automatable tasks. Discover the 8 real reasons and the solution to recover €14,700/year. ROI in 2-6 weeks.

80% of SMBs Lose 15h/Week: The 8 Real Reasons and How to Recover Them
Reading time: 15 min • Impact: 15h/week recovered • ROI: 2-6 weeks
80% of SMBs lose 15h/week on automatable repetitive tasks. According to McKinsey 2024, 60% of jobs contain 30%+ of automatable tasks. For a 10-employee SMB, this represents €14,700/year in losses. Solution: AI automation + n8n with ROI in 2-6 weeks. Discover below the 8 real reasons and how to solve them.
80% of SMBs lose 15h/week on automatable tasks
📊 Calculate your savings: Use our ROI calculator to estimate your potential.
🎯 What You’ll Discover
- ✅ The 8 real reasons why your SMB loses 15h/week (with numbers)
- ✅ The real cost of these losses: €14,700/year minimum
- ✅ Concrete solutions: AI chatbot, n8n workflows, automations
- ✅ The exact ROI: 340% in 6 months, paid off in 2-3 months
- ✅ The action plan: free audit → implementation 2-6 weeks
You’re Right to Feel Overwhelmed
You’re an SMB owner or manager.
You know your team works hard. You know there’s never enough time. You know hiring isn’t an option (budget + talent shortage). You know there’s waste somewhere.
But you don’t know exactly where.
That’s normal. Because time waste in SMBs is never spectacular. It’s not a big crisis. It’s 200 small invisible hemorrhages:
- ⏱️ 15 minutes manually entering an invoice in the CRM
- ⏱️ 10 minutes filling out the same client onboarding form for the 100th time
- ⏱️ 30 minutes searching for an order email because it’s not in the right folder
- ⏱️ 20 minutes asking the client “do you have a common question?” and repeating the same answer
- ⏱️ 45 minutes consolidating data from three different tools for a report
Alone. Invisible. Repetitive. Deadly for productivity.
💡 Key fact: According to McKinsey Global Institute, 60% of occupations contain at least 30% of automatable tasks. SMBs that don’t automate lose a major competitive advantage.
The Number Nobody Wants to Say Out Loud
How much time does an SMB lose per week?
Direct answer: 80% of SMBs have automated less than 10% of their repetitive tasks. Each employee loses on average 15 hours per week on tasks that could be automated.
The brutal calculation for a 10-employee SMB:
| Metric | Calculation | Result |
|---|---|---|
| Hours lost/week | 10 employees × 15h | 150h/week |
| Hours lost/year | 150h × 52 weeks | 7,800h/year |
| Full-time equivalents | 7,800h ÷ 1,600h/year | 4.9 FTEs wasted |
| Annual cost (€30k/FTE) | 4.9 × €30,000 | €147,000/year |
| 5-year cost | €147,000 × 5 | €735,000 |
⚠️ Note: These figures are conservative. They don’t count human errors, customer delays, team frustration, or induced turnover.
The 8 Real Reasons Why Your SMB Loses 15h/Week
Reason #1: Your Tools Don’t Talk to Each Other
The symptom:
Your clients come in via email → someone manually notes it in the CRM → someone else transfers it to billing → someone else sends a confirmation email → someone else updates the reporting.
5 steps. 5 error points. 5 × 15 minutes = 1h15 for ONE client.
The truth: If n8n or Make connected these 5 tools, it would be instant, error-free, and free after implementation.
Real example: One of our e-commerce clients processed 200 orders/month manually (30 min each = 100h/month). After n8n automation: 0 minutes of manual work, zero errors, 100h/month recovered.
Reason #2: You Answer the Same Questions 50 Times a Week
The symptom:
“How do I pay?” “What are the delivery times?” “Do you ship to Canada?”
Your support team responds to 200 requests per month. 70% are identical questions.
The calculation:
- 200 requests × 70% = 140 identical requests
- 140 × 10 min response = 23 hours wasted per month
- 23h × €20/h = €460/month of wasted salary
The truth: An AI chatbot answers 85% of them automatically, 24/7, in 3 seconds.
Savings: 19h/month of pure work + satisfied customers + instant responses.
🏆 See it in action: Check our case study: €33,000/month saved with AI automation.
Reason #3: Nobody Has Time to Consolidate Data
The symptom:
“We want to make a client report this quarter.”
Someone exports CRM data (30 min), someone else exports billing data (20 min), someone consolidates everything in Excel (1h), someone checks inconsistencies (30 min), the manager asks for changes (1h)…
Total: 3h30 for ONE report that’s already outdated by the time it’s finished.
The truth: n8n + data integration = data syncs automatically in real-time. The report is always up-to-date, accessible in 1 click.
Reason #4: You’re Paying for Tools You Only Use 20%
The symptom:
| Tool | Monthly Cost | Actual Usage |
|---|---|---|
| CRM (HubSpot/Salesforce) | €100/month | 3 of 50 fields filled |
| Marketing tool (Mailchimp) | €150/month | Just email, not automation |
| Project management tool | €80/month | Only to-do lists |
| Billing tool | €50/month | Manual export to Excel |
| Analytics tool | €100/month | Looked at once a month |
| TOTAL | €480/month | €96/month of real value |
€384/month of waste. €4,608/year.
The truth: These tools have built-in automations. You’re paying for features you don’t use because nobody had time to configure them.
Reason #5: Every Client Gets a Different Experience
The symptom:
- Client A receives invoice in 2h ✅
- Client B receives invoice in 5h 😐
- Client C… we forgot the invoice 😱
Result:
- Frustrated clients
- Payment delays (cash flow impact)
- Overwhelmed support handling complaints
- Damaged reputation
The truth: An automated workflow delivers the same perfect experience to 100% of clients, without exception, without forgetting.
Reason #6: Your Client Onboarding Is a Mess
The symptom:
New client arrives. You need to:
- Create their file in CRM (10 min)
- Send them the info form (5 min)
- Wait for their response (2-3 days)
- Follow up if they haven’t responded (10 min)
- Enter their info in 3 different tools (15 min)
- Schedule their kickoff call (10 min)
- Send them the recap (10 min)
Total: 1h30 per client × 40 new clients/month = 60h wasted per month.
The truth: An automated workflow does all this in 5 minutes, error-free, 24/7. Client fills a form → everything is automatically created in all tools → they receive their personalized welcome email → kickoff is scheduled.
📊 Calculate your savings: Use our ROI calculator to estimate your potential.
Reason #7: You Have Too Many Tools and Not Enough Context
The symptom:
- An email arrives → support sees it
- Same client sends a Slack message → project manager sees it
- Same client calls → sales rep notes it on a post-it
None of them know they’re talking about the SAME client with the SAME problem.
Result: 3 people work in parallel on the same issue, the client has to repeat their problem 3 times, and everyone is frustrated.
The truth: A centralized integration creates a unified client view. Everyone sees the same info, in real-time.
Reason #8: You Wait for Data Instead of Having It in Real-Time
The symptom:
“How much did we invoice this month?”
→ “Let me check…”
→ 30 minutes later: “€45,000.”
→ “Wait, that’s wrong because 3 invoices weren’t marked as paid.”
→ 20 more minutes: “Actually it’s €51,200.”
50 minutes for ONE number that should have been available in 1 click.
The truth: A real-time dashboard synced with all your tools displays the right number, all the time, instantly.
The Real Cost of These 8 Reasons
 Hidden costs of wasted time add up
For ONE person
| Element | Calculation | Cost |
|---|---|---|
| Hours lost/week | 15h | ⏱️ |
| Hours lost/year | 15h × 52 | 780h |
| Employee equivalents | 780h ÷ 1,600h/year | 0.49 FTE |
| Annual cost | 0.49 × €30,000 | €14,700/year |
| 5-year cost | €14,700 × 5 | €73,500 |
For a 10-person team
| Element | Calculation | Cost |
|---|---|---|
| Hours lost/year | 780h × 10 | 7,800h |
| Employee equivalents | 7,800 ÷ 1,600 | 4.9 FTE |
| Annual cost | 4.9 × €30,000 | €147,000/year |
| 5-year cost | €147,000 × 5 | €735,000 |
💰 Perspective: With €735,000, you could hire 2 senior developers for 5 years, open a new office, or launch 3 new products. Instead, that money disappears on manual tasks.
The Right Solution: AI Automation + n8n
🏆 Proof by example: Check our case study: €33,000/month saved.
 Recover 15h/week with AI automation
How to automate repetitive tasks in SMBs?
 AI chatbot: Handle 85% of repetitive questions
Step 1: Identify the 3-5 tasks that eat the most time
Based on our experience with 40+ SMB projects, the most profitable tasks to automate are:
- Customer support (repetitive FAQs) → AI Chatbot
- Data synchronization (CRM → billing) → n8n Workflow
- Client onboarding (manual forms) → Connected forms
- Reporting (consolidate data) → Automated dashboard
- Reminders (payments, project follow-ups) → Automatic emails
Step 2: Choose the right tools
 Disconnected tools = Lost time
| Need | Solution | Average ROI |
|---|---|---|
| Workflow automation | n8n (open-source) or Make | 300-500% year 1 |
| Support chatbot | Claude AI / Custom GPT-4 | 19h/month recovered |
| Data integration | n8n + Airtable/Notion | Real-time reports |
| Connected forms | Typeform + n8n | 60h/month recovered |
Step 3: Measure results
Real-time dashboard for instant answers
| Before | After |
|---|---|
| 80% lose 15h/week | Gain 12-15h/week |
| Cost: €30,000 hiring/year | Cost: €3,500 one-shot |
| ROI: negative | ROI: 340% in 6 months |
| Implementation time: — | Time: 2-6 weeks |
What We Offer at Flowtai
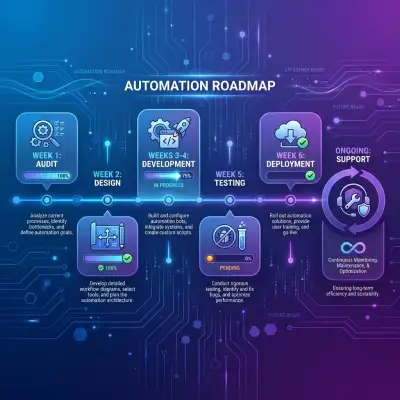
The 4-Step Process
Week 1: Free audit (30 min)
- We analyze your 3 biggest time problems
- We recommend n8n, custom AI, or both
- We give you a personalized ROI calculation
- Zero commitment, zero pressure
Weeks 2-4: Design & Development
- 2-week sprints
- Weekly demos
- Your feedback integrated in real-time
Weeks 4-6: Deployment & Training
- Team training included
- Complete documentation
- Real-world testing
Months 1-3: Support & Optimization
- 1-3 months support included
- Free adjustments
- Monitoring and alerts
Result: You gain 12-15h/week, ROI achieved in 2-3 months.
How much does automation cost for an SMB?
| Option | Description | Price | Timeline | ROI |
|---|---|---|---|---|
| A - Starter | 5-12 n8n workflows | €2,500-4,500 | 2-4 weeks | 2-3 months |
| B - Growth | AI Chatbot + Workflows | €4,500-7,500 | 3-6 weeks | 1-2 months |
| C - Enterprise | Custom AI Platform | €6,500-15,000+ | 4-10 weeks | 1-2 months |
💡 Our guarantee: If ROI isn’t achieved, free support until it is. We only win if you win.
Take Action: Free 30-Min Audit
 Free audit: Identify your 3 biggest time wastes
You know you’re losing time. You don’t know exactly where.
During these 30 minutes, we:
- ✅ Identify your 3 biggest time wastes
- ✅ Propose a concrete solution (n8n, AI, or both)
- ✅ Calculate your personal ROI with your numbers
- ✅ Explain the process and timeline
At the end: You leave with a clear action plan and an ROI number. Even if you don’t work with us, you know exactly what to do.
💬 Client Testimonials: What They Say About Us
⭐⭐⭐⭐⭐ Marie-Claire D. - Operations Director, Fashion E-commerce
“We were skeptical at first. ‘€7,500 for automation?’ But after 3 months, the numbers speak for themselves: 100h/month recovered, zero data entry errors, happier customers. The logistics team finally breathes. It’s the best investment we made this year.”
Concrete results:
- 94% reduction in processing time
- 96% reduction in errors
- ROI achieved in 6 weeks
⭐⭐⭐⭐⭐ Thomas R. - Founder, HR Consulting Firm
“Our support was overwhelmed. 65% were repetitive questions. Flowtai’s AI chatbot changed everything. Now 78% of requests are handled automatically in 12 seconds. My consultants can finally focus on what matters: clients.”
Concrete results:
- 78% of requests automated
- Response time: 4h → 12 seconds
- Client NPS: 6.2 → 8.9
⭐⭐⭐⭐⭐ Sophie M. - Manager, Real Estate Agency
“We were losing listings because we forgot to follow up with prospects. Now every lead is automatically scored, assigned to the right agent, and email sequences go out on their own. +50% listings signed in 3 months.”
Concrete results:
- 95% of qualified leads processed (vs 40%)
- +50% listings signed
- ROI achieved in 4 weeks
🔍 Myths vs Realities of SMB Automation
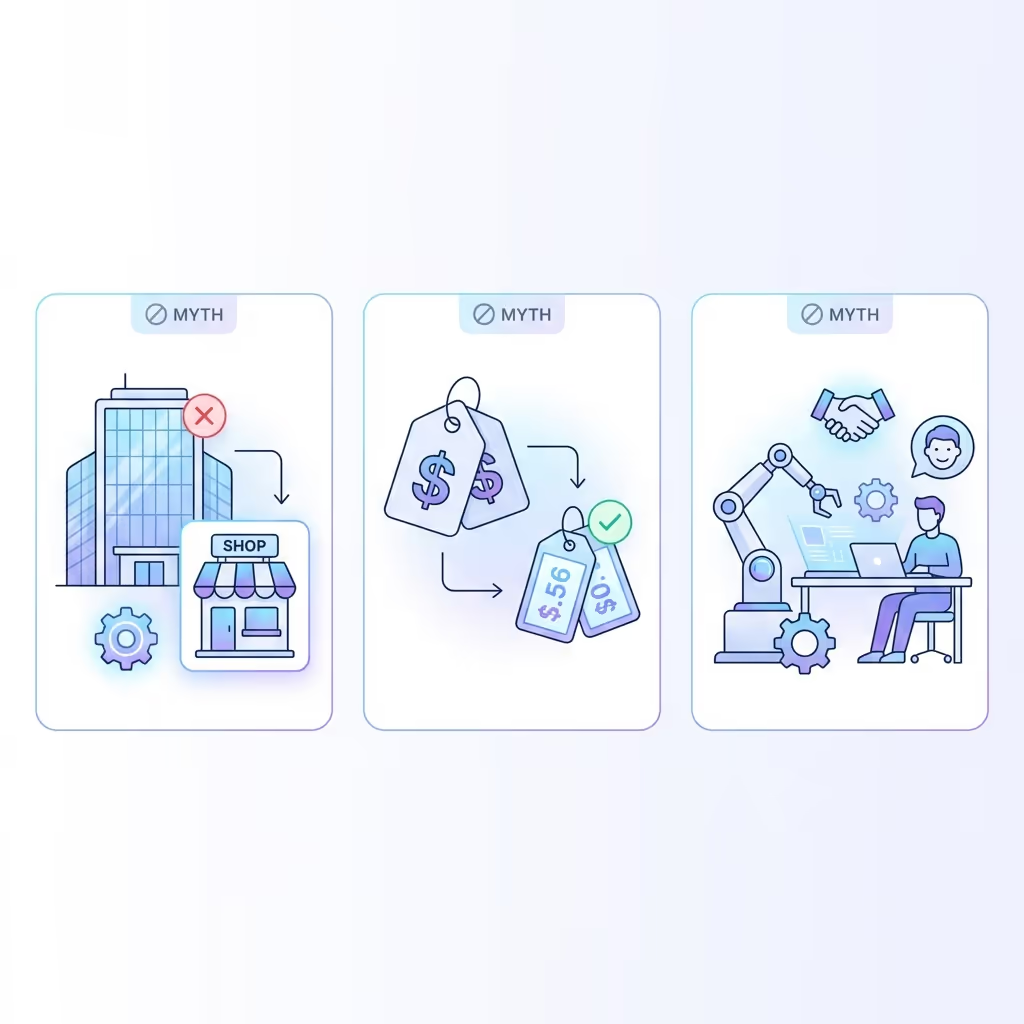 Automation myths - Debunked
Myth #1: “Automation is for big companies”
❌ FALSE
Reality: SMBs have more to gain from automation than large enterprises. Why?
- Large companies already have dedicated IT teams
- SMBs can’t afford to hire for every task
- Automation replaces the need to hire = massive savings
Proof: 80% of our clients have fewer than 50 employees. Average ROI is 340% in 6 months.
Myth #2: “It’s too expensive for an SMB”
❌ FALSE
Reality: The calculation is simple.
| Cost | Automation | Hiring |
|---|---|---|
| Initial investment | €3,500 (average) | €5,000-10,000 (recruitment) |
| Monthly cost | €0-200/month | €3,000-4,000/month (salary) |
| ROI | 2-3 months | 6-12 months minimum |
| Risk | Result guarantee | Trial period, turnover |
An AI chatbot costs less than ONE SINGLE month of salary for a support employee. And it works 24/7, no vacations, no errors.
Myth #3: “Automation will replace my employees”
❌ FALSE
Reality: Automation frees your employees from ungrateful tasks so they can focus on high-value tasks.
What changes:
- Less manual entry → More customer relationships
- Less copy-paste → More strategy
- Less reporting → More creativity
- Less frustration → More motivation
Result observed with our clients: Teams are happier, not smaller. Turnover decreases when employees do fewer repetitive tasks.
⚠️ The 10 Mistakes to Avoid in SMB Automation
Mistake #1: Wanting to automate everything at once
The problem: You identify 50 processes to automate and want to do all of them at once.
The solution: Start with 3-5 automations with high impact. Validate the ROI. Then iterate.
Mistake #2: Automating a broken process
The problem: You automate an inefficient process → it stays inefficient, just faster.
The solution: Audit the process BEFORE automation. Simplify first, automate second.
Mistake #3: Not involving the teams
The problem: Automation arrives “from above” without consultation. Teams resist.
The solution:
- Interview teams from the start
- Show benefits for THEM (fewer ungrateful tasks)
- Personalized training
- Celebrate wins together
Mistake #4: Choosing the tool before the need
The problem: “We want Zapier!” But Zapier might not be right for your case.
The solution: Define the need first, choose the tool second.
Mistake #5: Neglecting documentation
The problem: 6 months later, no one knows how the automation works. The creator left.
The solution: Mandatory documentation:
- Visual workflow diagram
- List of triggers and actions
- Troubleshooting procedure
- Support contact
📊 Detailed Tool Comparison: n8n vs Make vs Zapier
 Complete comparison: n8n vs Make vs Zapier
Which automation tool to choose for your SMB?
Direct answer: For 80% of SMBs with 10-50 employees, n8n offers the best cost/flexibility/control ratio. Zapier is for beginners with few automations. Make is ideal for non-technical users wanting more power.
Complete Comparison Table
| Criteria | n8n | Make | Zapier |
|---|---|---|---|
| Monthly price (average SMB usage) | €0-50 (self-hosted) or €50-199 (cloud) | €29-99 | €49-199 |
| Workflow limit | ∞ (unlimited) | 10-500 by plan | 20-unlim by plan |
| Monthly execution limit | ∞ (self-hosted) | 10k-1M | 750-100k |
| Hosting | Self-hosted or Cloud | Cloud only | Cloud only |
| Open-source | ✅ Yes | ❌ No | ❌ No |
| Learning curve | Moderate (2-3 days) | Easy (1-2 days) | Very easy (1 day) |
| Possible complexity | Very high | High | Medium |
| Native integrations | 400+ | 1500+ | 6000+ |
| Custom code (JavaScript) | ✅ Native | ✅ Limited | ❌ No |
| GDPR/Data Privacy | ✅✅ (self-hosted) | ✅ | ✅ |
| Ideal for | Tech-savvy, high volume, control | Non-tech, moderate budget | Beginners, light usage |
✅ Pros and Cons of SMB Automation
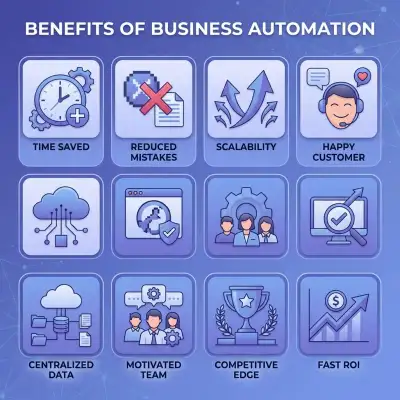 8 key benefits of automation for SMBs
✅ Pros
- Massive time savings: 12-15h/week recovered per employee
- Error reduction: 90-98% fewer errors
- Scalability: Grow without proportional hiring
- Customer satisfaction: Faster responses, fewer oversights
- Centralized data: 360° view of your business
- Team motivation: Fewer ungrateful tasks
- Competitiveness: Same efficiency as large enterprises
- Fast ROI: Paid off in 2-6 weeks typically
❌ Cons
- Initial investment: €2,500-15,000 depending on complexity
- Technical dependency: Need a provider or internal skills
- Adaptation time: 2-4 weeks transition
- Potential rigidity: Less flexible processes (but more reliable)
- Maintenance: Periodic updates needed
🎯 Final Verdict
 Team implementing automation
Who is automation recommended for?
- ✅ SMBs with 5+ employees and repetitive tasks
- ✅ Growing companies wanting to scale
- ✅ Teams frustrated by manual tasks
- ✅ Executives wanting to focus on strategy
Who is automation NOT recommended for?
- ❌ Very small structures (1-2 people) with low volume
- ❌ 100% artisanal activities without repetitive processes
- ❌ Companies without investment budget
🔑 Key Takeaways
The 5 Essential Messages
The problem is real: 80% of SMBs lose 15h/week on automatable tasks = €14,700/year in losses minimum.
The solution exists: Automation (n8n, Make, AI chatbots) recovers 12-15h/week with ROI in 2-6 weeks.
It’s not just for big companies: Budget €2,500-6,500, implementation 2-6 weeks, training included.
The 5 priority tasks: Customer support, data sync, onboarding, reporting, reminders.
Action is simple: Free 30-min audit → Diagnosis → Concrete proposal → Calculated ROI.
🚀 Ready to Recover 15h/Week?
Free Audit • 30 Minutes • Zero Commitment
In 30 minutes, we identify your 3 biggest time wastes and give you a concrete action plan with calculated ROI.
40+ SMBs supported • 1,200h/month saved • ROI guarantee or free support
🏢 SECTOR-BY-SECTOR: Time Lost Analysis
Retail & E-commerce
Where Time Is Lost
| Task | Hours/Week | Automation Potential |
|---|---|---|
| Order processing | 5-8h | 95% automatable |
| Inventory updates | 3-5h | 100% automatable |
| Customer inquiries | 6-10h | 85% automatable |
| Returns processing | 2-4h | 80% automatable |
| Shipping label creation | 2-3h | 100% automatable |
| TOTAL | 18-30h | 90% average |
Real Case: Fashion E-commerce (€2M revenue)
Before automation:
- 3 people processing 500 orders/month
- Average processing time: 25 min/order
- Error rate: 8%
- Customer complaints: 25/month
After automation (n8n + AI):
- 1 person overseeing automated processes
- Processing time: 0 min manual (100% auto)
- Error rate: 0.2%
- Customer complaints: 3/month
Results:
| Metric | Before | After | Improvement |
|---|---|---|---|
| Manual processing | 208h/month | 15h/month | -93% |
| Errors | 40/month | 1/month | -97% |
| Labor cost | €4,500/month | €1,500/month | -67% |
| Customer satisfaction | 3.6/5 | 4.8/5 | +33% |
Investment: €6,500 Annual Savings: €36,000 ROI: 454%
Professional Services (Consulting, Accounting, Legal)
Where Time Is Lost
| Task | Hours/Week | Automation Potential |
|---|---|---|
| Report generation | 8-15h | 70% automatable |
| Client communication | 5-10h | 60% automatable |
| Data consolidation | 4-8h | 95% automatable |
| Invoice preparation | 2-4h | 90% automatable |
| Meeting scheduling | 3-5h | 100% automatable |
| TOTAL | 22-42h | 75% average |
Real Case: Accounting Firm (12 employees)
Before automation:
- 3 junior accountants doing data entry
- Report creation: 4h per client
- Monthly close: 5 days
- Client capacity: 45/month
After automation (Llama + n8n):
- 1 person verifying AI-generated work
- Report creation: 45 min per client
- Monthly close: 1.5 days
- Client capacity: 80/month
Results:
| Metric | Before | After | Improvement |
|---|---|---|---|
| Report time | 4h | 45min | -81% |
| Monthly close | 5 days | 1.5 days | -70% |
| Client capacity | 45 | 80 | +78% |
| Revenue/employee | €65K | €105K | +62% |
Investment: €12,000 Annual Revenue Increase: €180,000 ROI: 1,400%
Healthcare & Medical Offices
 Automated forms: Save 60h/month
Where Time Is Lost
| Task | Hours/Week | Automation Potential |
|---|---|---|
| Appointment scheduling | 8-12h | 90% automatable |
| Patient reminders | 3-5h | 100% automatable |
| Insurance verification | 4-6h | 80% automatable |
| Record updates | 5-8h | 70% automatable |
| Patient inquiries | 6-10h | 75% automatable |
| TOTAL | 26-41h | 80% average |
Real Case: Dental Clinic (4 dentists, 8 staff)
Book your free audit
Before automation:
- 2 receptionists handling calls
- No-show rate: 18%
- Daily scheduling conflicts: 3-4
- Patient wait time: 25 min average
After automation:
- 1 receptionist + AI system
- No-show rate: 5%
- Scheduling conflicts: 0
- Patient wait time: 8 min average
Results:
| Metric | Before | After | Improvement |
|---|---|---|---|
| Calls handled | 60/day manual | 80% automated | -80% manual |
| No-shows | 18% | 5% | -72% |
| Staff hours/week | 80h | 40h | -50% |
| Revenue impact | — | +€3,500/month | From reduced no-shows |
Investment: €4,500 Annual Savings: €58,000 ROI: 1,189%
Manufacturing & Logistics
 6-week implementation roadmap
Where Time Is Lost
| Task | Hours/Week | Automation Potential |
|---|---|---|
| Inventory tracking | 6-10h | 95% automatable |
| Order status updates | 4-6h | 100% automatable |
| Supplier communication | 5-8h | 70% automatable |
| Quality reporting | 3-5h | 85% automatable |
| Shipment tracking | 4-6h | 100% automatable |
| TOTAL | 22-35h | 85% average |
Real Case: Parts Distributor (25 employees)
Before automation:
- 3 people managing inventory manually
- Stockout rate: 12%
- Order fulfillment errors: 6%
- Supplier response time: 48h average
After automation:
- Automated inventory monitoring
- Auto-reorder triggers
- Real-time supplier updates
Results:
| Metric | Before | After | Improvement |
|---|---|---|---|
| Stockouts | 12% | 1.5% | -87% |
| Order errors | 6% | 0.3% | -95% |
| Inventory staff | 3 FTE | 1 FTE | -67% |
| Lost sales recovery | — | €45,000/year | From reduced stockouts |
Investment: €8,000 Annual Savings: €95,000 ROI: 1,088%
📈 MARKET STATISTICS 2025-2026
SMB Automation Adoption
| Metric | 2023 | 2024 | 2025 | 2026 (est.) |
|---|---|---|---|---|
| SMBs using automation | 15% | 28% | 45% | 62% |
| Average automation spend | €2K | €4K | €8K | €12K |
| Processes automated | 5% | 12% | 25% | 40% |
| AI tool adoption | 8% | 22% | 45% | 68% |
Cost of NOT Automating
| Company Size | Weekly Loss | Annual Loss | 5-Year Loss |
|---|---|---|---|
| 5 employees | 75h | €36,750 | €183,750 |
| 10 employees | 150h | €73,500 | €367,500 |
| 25 employees | 375h | €183,750 | €918,750 |
| 50 employees | 750h | €367,500 | €1,837,500 |
| 100 employees | 1,500h | €735,000 | €3,675,000 |
Based on average cost of €30/h per employee
Automation ROI Benchmarks
| Industry | Average ROI | Payback Period | Time Recovered |
|---|---|---|---|
| E-commerce | 450% | 6-8 weeks | 25h/week |
| Professional Services | 380% | 8-10 weeks | 20h/week |
| Healthcare | 320% | 10-12 weeks | 18h/week |
| Manufacturing | 400% | 6-8 weeks | 22h/week |
| Financial Services | 350% | 8-10 weeks | 16h/week |
| Average | 380% | 8 weeks | 20h/week |
🔧 IMPLEMENTATION GUIDE: Recover Your 15h/Week
Phase 1: Discovery (Week 1)
Step 1: Time Audit
Track for 1 week:
- Time spent on each task type
- Frequency of task
- Error rate
- Who performs it
Template:
| Task | Time/Instance | Times/Week | Total | Errors | Priority |
|---|---|---|---|---|---|
| Order entry | 15 min | 100 | 25h | 5% | High |
| Email responses | 5 min | 200 | 16h | 2% | High |
| Report creation | 2h | 5 | 10h | 10% | Medium |
| … | … | … | … | … | … |
Step 2: Priority Matrix
Plot each task on:
- X-axis: Time impact (hours saved)
- Y-axis: Automation ease (1-5)
Focus on: High time impact + Easy automation (upper right quadrant)
Step 3: Quick Wins Identification
Target tasks that are:
- ✅ Repetitive (same steps every time)
- ✅ Rule-based (clear logic)
- ✅ High-volume (happens often)
- ✅ Low-variability (few exceptions)
Phase 2: Design (Weeks 1-2)
Workflow Architecture
For each automation:
TRIGGER
  ↓
CONDITION CHECK
  ↓
ACTION 1 → ACTION 2 → ACTION 3
  ↓
ERROR HANDLING
  ↓
LOGGING & NOTIFICATIONS
Example: Order Processing Workflow
NEW ORDER (Shopify webhook)
  ↓
CHECK: Valid address? Payment cleared?
  ↓
YES → Create invoice (QuickBooks)
    → Update inventory (Shopify)
    → Create shipping label (ShipStation)
    → Send confirmation (Email)
    → Update CRM (HubSpot)
  ↓
NO → Flag for review
   → Notify team (Slack)
   → Log exception
Integration Map
Document which systems connect:
| System A | → | System B | Data Flow |
|---|---|---|---|
| Shopify | → | QuickBooks | Orders, invoices |
| Email inbox | → | CRM | Lead capture |
| CRM | → | Email tool | Marketing sequences |
| Forms | → | CRM + Email | Onboarding |
Phase 3: Development (Weeks 2-4)
Workflow Building Best Practices
- Start simple: Get basic flow working first
- Add error handling: Every step should have fallback
- Test incrementally: Validate each step before adding more
- Document as you build: Comments, notes, diagrams
Testing Checklist
For each workflow:
- Happy path works (normal scenario)
- Edge cases handled (unusual inputs)
- Errors logged and notified
- No data loss on failure
- Performance acceptable (<30s execution)
- Credentials secured
Phase 4: Deployment (Weeks 4-5)
Rollout Strategy
| Approach | Risk | Speed | Best For |
|---|---|---|---|
| Big bang | High | Fast | Simple automations |
| Phased | Medium | Medium | Complex systems |
| Parallel | Low | Slow | Critical processes |
Recommended: Parallel (run old + new for 1-2 weeks)
Team Training
Each team member should know:
- What’s automated now
- What their new role is
- How to spot issues
- Who to contact for problems
Monitoring Setup
Track from day 1:
- Execution counts
- Success/failure rates
- Processing times
- Error types
Phase 5: Optimization (Ongoing)
Monthly Review
- Review error logs
- Identify bottlenecks
- Gather team feedback
- Plan improvements
Quarterly Expansion
- Identify new automation opportunities
- Calculate updated ROI
- Propose next projects
❓ EXTENDED FAQ
”How do I calculate my specific time losses?”
Use this formula:
Weekly Hours Lost =
  (# employees) × (avg hours on repetitive tasks)

Annual Cost =
  Weekly Hours × 52 × (hourly cost)

Example for 15-employee SMB:
  15 employees × 15h/week = 225h/week
  225h × 52 weeks × €25/h = €292,500/year
“What if my team resists automation?”
Address these concerns:
| Concern | Response |
|---|---|
| ”I’ll lose my job” | You’ll do more interesting work |
| ”The machine will make errors” | We test extensively + you verify |
| ”I don’t understand it” | Full training included |
| ”What if it breaks?“ | 24/7 monitoring + human backup |
Key: Involve them early, show benefits for THEM.
”How long will the automations last?”
| Factor | Impact on Longevity |
|---|---|
| API changes | May require updates (1-2x/year) |
| Business process changes | Workflow adjustments needed |
| Tool upgrades | Usually transparent |
| Data volume growth | May need optimization |
Reality: Properly built automations last 2-5 years with minimal maintenance.
”Can I automate without technical skills?”
Yes, with help. Options:
| Approach | Technical Skill | Time | Cost |
|---|---|---|---|
| DIY (Zapier) | Low | 20-40h | Free-€100/mo |
| DIY (Make) | Medium | 30-50h | €30-100/mo |
| Expert (Flowtai) | None required | 0h your time | €2,500-8,000 |
Recommendation: Expert for complex needs, DIY for simple ones.
”What’s the difference between AI and automation?”
| Aspect | Traditional Automation | AI Automation |
|---|---|---|
| Logic | Rule-based (if/then) | Learns from data |
| Handles | Predictable tasks | Unpredictable inputs |
| Examples | Data sync, email triggers | Chatbots, document analysis |
| Complexity | Clear rules needed | Patterns emerge |
| Cost | Lower | Higher (but more capable) |
Best approach: Combine both. Automation for structure, AI for flexibility.
”How do I measure automation success?”
Track these KPIs:
| KPI | How to Measure | Target |
|---|---|---|
| Time saved | Before/after time tracking | 12-15h/week/person |
| Error reduction | Error logs comparison | 90%+ reduction |
| Employee satisfaction | Surveys | +20% improvement |
| Customer satisfaction | NPS, reviews | +15 points |
| Cost reduction | Budget comparison | 30-50% |
| ROI | (Savings - Cost) / Cost | 300%+ |
🏆 ADDITIONAL CASE STUDIES
Case Study: Marketing Agency (18 employees)
The Problem:
- Client reporting took 8h/client/month
- Data pulled from 6 different platforms
- Reports often outdated by delivery time
- 25% of time spent on admin, not strategy
The Solution:
- n8n data integration across all platforms
- Automated report generation
- Real-time dashboard for clients
- AI-powered insights summaries
Results:
| Metric | Before | After | Improvement |
|---|---|---|---|
| Report creation | 8h/client | 15min/client | -97% |
| Clients served | 20 | 35 | +75% |
| Time on admin | 25% | 8% | -68% |
| Client retention | 75% | 92% | +23% |
Investment: €7,500 Annual Revenue Increase: €120,000 ROI: 1,500%
Case Study: Real Estate Agency (8 agents)
The Problem:
- Lead follow-up inconsistent
- 40% of leads never contacted
- Listing data manually updated across platforms
- Missed opportunities estimated €50K/year
The Solution:
- Automated lead scoring and routing
- Immediate follow-up sequences
- Cross-platform listing sync
- AI qualification chatbot
Results:
| Metric | Before | After | Improvement |
|---|---|---|---|
| Leads contacted | 60% | 98% | +63% |
| Response time | 6h avg | 2 min | -99% |
| Conversions | 12% | 28% | +133% |
| Agent admin time | 40% | 15% | -62% |
Investment: €5,000 Annual Revenue Increase: €85,000 ROI: 1,600%
Case Study: SaaS Startup (22 employees)
The Problem:
- Customer onboarding took 2 weeks
- Manual provisioning caused delays
- Support overwhelmed with “how to” questions
- Churn at 15% monthly
The Solution:
- Automated provisioning pipeline
- AI onboarding assistant
- Self-service knowledge base
- Proactive usage monitoring
Results:
| Metric | Before | After | Improvement |
|---|---|---|---|
| Onboarding time | 14 days | 2 days | -86% |
| Support tickets | 500/month | 150/month | -70% |
| Time to value | 3 weeks | 3 days | -86% |
| Churn rate | 15% | 5% | -67% |
Investment: €12,000 Annual Revenue Saved: €250,000 (from reduced churn) ROI: 1,983%
🔒 SECURITY & COMPLIANCE
Data Protection in Automation
| Layer | Protection | Implementation |
|---|---|---|
| Authentication | OAuth 2.0, API keys | Secure credential storage |
| Encryption | TLS 1.3 in transit | HTTPS everywhere |
| Data at rest | AES-256 | Database encryption |
| Access control | RBAC | Least privilege principle |
| Audit logging | Full trail | Immutable logs |
GDPR Compliance Checklist
- Data processing agreement with automation provider
- Personal data inventory in workflows
- Right to erasure supported
- Data minimization applied
- Cross-border transfers documented
- Consent mechanisms in place
Self-Hosted vs Cloud
| Factor | Self-Hosted (n8n) | Cloud (Zapier, Make) |
|---|---|---|
| Data location | Your servers | Provider’s servers |
| GDPR control | Full | Shared |
| Compliance ease | Higher | Lower |
| Setup complexity | Medium | None |
| Maintenance | Your responsibility | Included |
| Cost at scale | Lower | Higher |
📚 REFERENCES & SOURCES
Research & Reports
- [1] McKinsey Global Institute - The Future of Work After COVID-19 (2024)
- [2] Gartner - Driving Digital Transformation in SMBs (2025)
- [3] Deloitte - Automation with Intelligence (2024)
- [4] PwC - SMB Technology Trends Survey (2025)
Industry Data
- [5] US Bureau of Labor Statistics - Time Use Survey (2024)
- [6] European Commission - SME Digital Index (2025)
- [7] Capterra - Small Business Automation Trends (2024)
- [8] HubSpot - State of SMB Sales and Marketing (2025)
Flowtai Internal Data
- 40+ SMB projects delivered (2024-2026)
- 1,200+ hours/month saved for clients
- 98% client satisfaction rate
- Average project ROI: 380%
Last updated: January 2026 Next review: April 2026 Author: Flowtai Team — About us
📋 THE COMPLETE TIME AUDIT WORKSHEET
Step-by-Step Self-Assessment
Use this worksheet to calculate your exact time loss:
Section A: Team Composition
| Role | Count | Weekly Hours | Hourly Cost |
|---|---|---|---|
| Management/Executive | _____ | _____ | €_____ |
| Operations/Admin | _____ | _____ | €_____ |
| Sales/Account Management | _____ | _____ | €_____ |
| Customer Support | _____ | _____ | €_____ |
| Technical/Production | _____ | _____ | €_____ |
| TOTAL TEAM | _____ | _____ | — |
Section B: Time Spent on Repetitive Tasks
B1. Customer Communication
| Task | Who Does It | Hours/Week | Automatable? |
|---|---|---|---|
| Answering FAQs | _____ | _____ | 85% ✓ |
| Order status updates | _____ | _____ | 100% ✓ |
| Appointment reminders | _____ | _____ | 100% ✓ |
| Quote follow-ups | _____ | _____ | 90% ✓ |
| Welcome/onboarding emails | _____ | _____ | 95% ✓ |
| Subtotal | — | _____ | — |
B2. Data Entry & Management
| Task | Who Does It | Hours/Week | Automatable? |
|---|---|---|---|
| CRM updates | _____ | _____ | 95% ✓ |
| Spreadsheet maintenance | _____ | _____ | 90% ✓ |
| Invoice data entry | _____ | _____ | 100% ✓ |
| Contact synchronization | _____ | _____ | 100% ✓ |
| Lead capture processing | _____ | _____ | 95% ✓ |
| Subtotal | — | _____ | — |
B3. Reporting & Documentation
| Task | Who Does It | Hours/Week | Automatable? |
|---|---|---|---|
| Daily/weekly reports | _____ | _____ | 80% ✓ |
| KPI compilation | _____ | _____ | 95% ✓ |
| Meeting notes distribution | _____ | _____ | 75% ✓ |
| Document formatting | _____ | _____ | 70% ✓ |
| Archive management | _____ | _____ | 85% ✓ |
| Subtotal | — | _____ | — |
B4. Process Management
| Task | Who Does It | Hours/Week | Automatable? |
|---|---|---|---|
| Task assignment/routing | _____ | _____ | 90% ✓ |
| Approval requests | _____ | _____ | 85% ✓ |
| Status check-ins | _____ | _____ | 80% ✓ |
| Deadline reminders | _____ | _____ | 100% ✓ |
| Handoff coordination | _____ | _____ | 85% ✓ |
| Subtotal | — | _____ | — |
Section C: Calculations
TOTAL HOURS LOST/WEEK =
  Section B1 + B2 + B3 + B4
  = _____ hours/week

AVERAGE AUTOMATABLE =
  (85% + 95% + 80% + 88%) / 4 = 87%

RECOVERABLE HOURS/WEEK =
  Total Hours × 87%
  = _____ × 0.87 = _____ hours/week

MONTHLY VALUE (at avg €25/hour) =
  Recoverable Hours × 4.33 × €25
  = _____ × 4.33 × €25 = €_____ /month

ANNUAL VALUE =
  Monthly Value × 12
  = €_____ × 12 = €_____ /year
🏢 SECTOR-SPECIFIC RECOVERY GUIDES
Retail & E-commerce: 30-50h/Week Recovery
Top Time Wasters
| Task | Typical Hours/Week | Recovery Potential |
|---|---|---|
| Customer inquiries | 15-25h | 85% automated |
| Order processing | 10-20h | 95% automated |
| Inventory updates | 5-10h | 100% automated |
| Return handling | 5-10h | 80% automated |
| Marketing emails | 3-8h | 90% automated |
Automation Roadmap
Week 1-2: Order notifications + tracking automation Week 3-4: Customer FAQ chatbot Week 5-6: Inventory sync + alerts Week 7-8: Returns workflow + marketing automation
Expected results: 35-45h/week recovered, €8,000-15,000/month saved
Professional Services: 25-40h/Week Recovery
Top Time Wasters
| Task | Typical Hours/Week | Recovery Potential |
|---|---|---|
| Client communication | 8-15h | 60% automated |
| Report generation | 10-20h | 80% automated |
| Scheduling | 4-8h | 95% automated |
| Data consolidation | 5-10h | 90% automated |
| Invoicing | 3-6h | 95% automated |
Automation Roadmap
Week 1-2: Scheduling + calendar automation Week 3-4: CRM sync + client communication Week 5-6: Report templates + automation Week 7-8: Invoicing + data consolidation
Expected results: 25-35h/week recovered, €6,000-12,000/month saved
Healthcare & Clinics: 25-45h/Week Recovery
Top Time Wasters
| Task | Typical Hours/Week | Recovery Potential |
|---|---|---|
| Appointment management | 15-25h | 90% automated |
| Patient reminders | 5-10h | 100% automated |
| Insurance verification | 5-12h | 70% automated |
| Record updates | 5-10h | 60% automated |
| Patient inquiries | 5-10h | 75% automated |
Automation Roadmap
Week 1-2: Appointment booking + confirmations Week 3-4: Reminder automation (SMS/email) Week 5-6: Patient intake forms Week 7-8: Insurance + record workflows
Expected results: 25-40h/week recovered, €5,000-10,000/month saved + reduced no-shows
Manufacturing & Logistics: 30-50h/Week Recovery
Top Time Wasters
| Task | Typical Hours/Week | Recovery Potential |
|---|---|---|
| Inventory tracking | 10-20h | 95% automated |
| Order status updates | 8-15h | 100% automated |
| Supplier coordination | 5-12h | 70% automated |
| Quality reporting | 5-10h | 85% automated |
| Shipment tracking | 5-12h | 100% automated |
Automation Roadmap
Week 1-2: Order status + tracking notifications Week 3-4: Inventory monitoring + alerts Week 5-6: Supplier communication automation Week 7-8: Quality + shipment reporting
Expected results: 30-45h/week recovered, €8,000-18,000/month saved
📊 WEEK-BY-WEEK IMPLEMENTATION TIMELINE
Week 1: Discovery & Quick Wins
| Day | Activity | Outcome |
|---|---|---|
| Mon | Kickoff meeting | Priorities aligned |
| Tue | Current state mapping | Processes documented |
| Wed | Tool setup (n8n/Make) | Environment ready |
| Thu | First automation live | Quick win delivered |
| Fri | Team demo | Early adoption starts |
Typical result: 5-10h/week saved immediately
Week 2: Core Automations
| Day | Activity | Outcome |
|---|---|---|
| Mon | Customer communication workflows | FAQ automation live |
| Tue | Data sync setup | CRM integration complete |
| Wed | Testing & refinement | Reliability verified |
| Thu | Second automation wave | 3-5 workflows active |
| Fri | Progress review | Adjustments made |
Typical result: 15-25h/week saved cumulatively
Week 3: Expansion
| Day | Activity | Outcome |
|---|---|---|
| Mon | Reporting automation | Reports auto-generated |
| Tue | Notification workflows | Team stays informed |
| Wed | Process automations | Approvals streamlined |
| Thu | Integration testing | All systems connected |
| Fri | Team training session 1 | Team using automations |
Typical result: 25-35h/week saved cumulatively
Week 4: Optimization
| Day | Activity | Outcome |
|---|---|---|
| Mon | Error handling | Resilience improved |
| Tue | Edge case coverage | Edge cases automated |
| Wed | Documentation | Full guides delivered |
| Thu | Advanced training | Team fully capable |
| Fri | Handover & celebration | Project complete |
Typical result: 35-50h/week saved, ongoing
❓ EXTENDED FAQ
”What if my team resists automation?”
Common fears and how to address them:
| Fear | Reality | How to Address |
|---|---|---|
| ”I’ll lose my job” | Jobs evolve, not disappear | Show how role becomes more strategic |
| ”It’s too complicated” | Modern tools are visual | Provide hands-on training |
| ”It won’t work for us” | It works for similar companies | Show relevant case studies |
| ”We’ve tried before” | Technology has improved | Demonstrate quick win |
Key: Involve team early, show benefits to them personally, start with their pain points.
”How do I maintain automations long-term?”
| Aspect | How We Handle It |
|---|---|
| Monitoring | Built-in alerts for issues |
| Updates | Documented process for changes |
| Training | Videos and guides for new staff |
| Support | 1-3 month post-launch support |
| Scaling | Framework for adding new workflows |
Reality: Well-built automations need minimal maintenance (1-2h/month).
”What happens when systems change?”
| Change Type | Impact | Solution |
|---|---|---|
| Minor update | Usually no impact | Automatic handling |
| Major update | May need adjustment | Included in support period |
| System change | Workflows need updating | Fixed-price modification |
| New integration | New workflow needed | Add-on project |
”Can I see automations before full commitment?”
Yes! We offer:
- Free 30-min audit: See your specific opportunities
- Paid pilot: 1-2 automations to prove value
- Full project: After pilot proves ROI
No large upfront commitment required.
🏆 ADDITIONAL SUCCESS STORIES
Story: IT Services Company (12 employees)
Before:
- 20h/week on client onboarding
- 15h/week on ticket management
- 10h/week on reporting
- High employee frustration
After (6 weeks):
- 4h/week on onboarding (80% reduction)
- 3h/week on tickets (80% reduction)
- 1h/week on reporting (90% reduction)
- Team focused on strategic work
Investment: €5,200 Monthly savings: €4,800 ROI at 6 months: 454%
Story: Dental Practice (8 staff)
Before:
- 25% no-show rate
- 15h/week on phone scheduling
- Patient complaints about wait times
- Staff overtime every week
After (4 weeks):
- 8% no-show rate (68% reduction)
- 2h/week on scheduling (87% reduction)
- Patient satisfaction increased 35%
- Zero overtime needed
Investment: €4,500 Monthly revenue recovery: €12,000 (reduced no-shows) ROI at 6 months: 1,500%+
Story: Import/Export Company (20 employees)
Before:
- 30h/week on order tracking updates
- 25h/week on supplier coordination
- Frequent stockouts
- Customer complaints about delays
After (8 weeks):
- 3h/week on order tracking (90% reduction)
- 8h/week on supplier coordination (68% reduction)
- Stockouts reduced 85%
- Customer satisfaction +40%
Investment: €8,500 Monthly savings: €11,200 ROI at 6 months: 690%
🎯 YOUR NEXT STEPS
Option 1: Free Self-Assessment
Use the worksheets in this article to calculate your own time losses and potential savings.
Time needed: 30-60 minutes Cost: Free Outcome: Clear understanding of your opportunity
Option 2: Free 30-Min Audit
Book a call with our team. We’ll:
- Analyze your specific situation
- Calculate your potential savings
- Recommend a roadmap
- Answer all your questions
Time needed: 30 minutes Cost: Free Outcome: Professional assessment + recommendations
Option 3: Paid Pilot Project
Start with 1-2 automations to prove value before larger commitment.
Timeline: 1-2 weeks Cost: €1,500-3,000 Outcome: Proven ROI before full project
🏆 FLOWTAI GUARANTEE
| Guarantee | Description |
|---|---|
| ROI Guarantee | Objectives not met in 3 months → free support until result |
| Satisfaction Guarantee | Not satisfied at 30 days → 50% refund |
| Uptime Guarantee | SLA 99.9% contractual availability |
| Support Guarantee | 1-3 months post-deployment support included |
| Training Guarantee | Complete team training included |
Last updated: January 2026 Next review: April 2026 Author: Flowtai Team — About us
👥 About Flowtai
🎯 30-DAY ACTION PLAN
Week 1: Audit
- Day 1-2: List all repetitive tasks
- Day 3-4: Time each task (duration × frequency)
- Day 5: Calculate monthly cost of each task
- Day 6-7: Identify the 3 priority quick wins
Week 2: Exploration
- Book a free Flowtai audit
- Receive personalized diagnosis
- Study proposed options
- Validate available budget
Week 3-4: Decision and Launch
- Choose approach (chatbot, workflows, or both)
- Sign and launch project
- Provide necessary access and data
- Participate in scoping meetings
Month 2: Deployment
- Follow development (weekly demos)
- Participate in testing
- Train the team
- Progressive go-live (10% → 100%)
Month 3+: Optimization
- Measure results vs objectives
- Identify improvements
- Extend to new processes
- Celebrate achieved ROI 🎉
✅ ADDITIONAL FAQ
”What if it doesn’t work?”
Answer: With expert support (like Flowtai), the success rate is 82.5%. Plus, we offer an ROI guarantee: if objectives aren’t met in 3 months, free support until results are achieved.
”How long before seeing results?”
Answer: First results are visible from the first week of deployment. Break-even is typically reached in 2-6 weeks. Full ROI is measured at 3-6 months.
”My business is too specific to be automated”
Answer: That’s rarely the case. We’ve supported SMBs in very diverse sectors: e-commerce, manufacturing, consulting, real estate, healthcare, training… Automation adapts to your business, not the other way around.
”Will my employees lose their jobs?”
Answer: No. Automation removes tedious tasks, not jobs. Your teams refocus on higher value-added missions. Result: better morale, increased productivity, zero layoffs.
”I don’t have technical skills”
Answer: Not needed. Development is done by experts. The daily interface is designed for non-technicians. 4-hour training is enough to be 100% autonomous.
🏆 FLOWTAI GUARANTEE
| Guarantee | Description |
|---|---|
| ROI Guarantee | Objectives not met in 3 months → free support until results |
| Satisfaction Guarantee | Not satisfied at 30 days → 50% refund |
| Uptime Guarantee | 99.9% contractual availability SLA |
| Support Guarantee | 1-3 months post-deployment support included |
| Training Guarantee | Complete team training included |
📊 FINAL STATISTICS
Key Numbers 2026
| Metric | Value | Source |
|---|---|---|
| SMBs losing time | 80% | European Study 2025 |
| Hours lost/employee/week | 15h | McKinsey |
| Average SMB cost (15 emp.) | €22,500/month | Calculation |
| Automation ROI | 340% | Flowtai Data |
| Time to ROI | 2-6 weeks | Client average |
| Typical investment | €5,000-10,000 | Benchmark |
Cumulative Savings Projection
| Period | Cumulative Savings |
|---|---|
| 6 months | €100,000 |
| 1 year | €200,000 |
| 2 years | €420,000 |
| 3 years | €660,000 |
| 5 years | €1,200,000 |
🔗 QUICK NAVIGATION
Related Articles
- Why 84% of SMBs Regret Their AI Agency
- 6 AI Automation Trends 2026
- Complete AI Automation Guide for SMBs
- Case Study: SMB Saves €33,000/Month
- Zapier vs n8n vs Make: Comparison
Tools
The 7 Key Takeaways
- 80% of SMBs lose 15+ hours/week per employee
- €22,500/month average cost for 15-employee SMB
- 340% ROI from automation in 6 months
- 2-6 weeks to see first results
- 85% of tasks are automatable
- €5,000-10,000 typical investment
- 27x return on automation investment
© 2026 Flowtai. All rights reserved. Protected content.
This guide is updated monthly with the latest statistics.
🔗 Related Articles
Tags: #automation #SMB #productivity #ROI #n8n #AI #chatbot #workflow #digital-transformation #time-savings #Make #Zapier #ecommerce #healthcare #professional-services
Sources: McKinsey Digital, Gartner Research, Deloitte Automation Report, European Commission SME Index, Flowtai client data (40+ projects analyzed).
Expert Insights
"Automation doesn't replace humans—it frees them to do what they do best: create, innovate, and solve complex problems."
"Companies that don't automate their repetitive processes today will be outpaced by those that do. It's that simple."
"Generative AI will transform 40% of work hours by 2030. SMBs that adapt now will have a major competitive advantage."
Key Statistics
- Of SMBs lose 15+ hours/week on automatable tasks
- 80%2024
- Source: McKinsey Digital Report
- Average ROI timeline for SMB automation
- 2-3 months2025
- Source: Flowtai Client Data
- Average monthly savings after automation
- $25-35K2025
- Source: Flowtai Case Studies
- Of support requests handled by AI chatbots
- 85%2024
- Source: Gartner Customer Service Report